How metrics lose their context

When software metrics flow upwards through the enterprise, there is compression and loss at every level. An engineer implements a system that emits thousands of metrics, a subset of which are promoted to a dashboard. Then, a smaller subset gets picked up by a manager and dropped into a KPI deck for leadership. And finally, an even smaller subset makes it into a quarterly review where a P&L owner decides whether the product is healthy enough to keep investing in, a decision made on the basis of a number that’s been stripped of the context that would make it most meaningful.
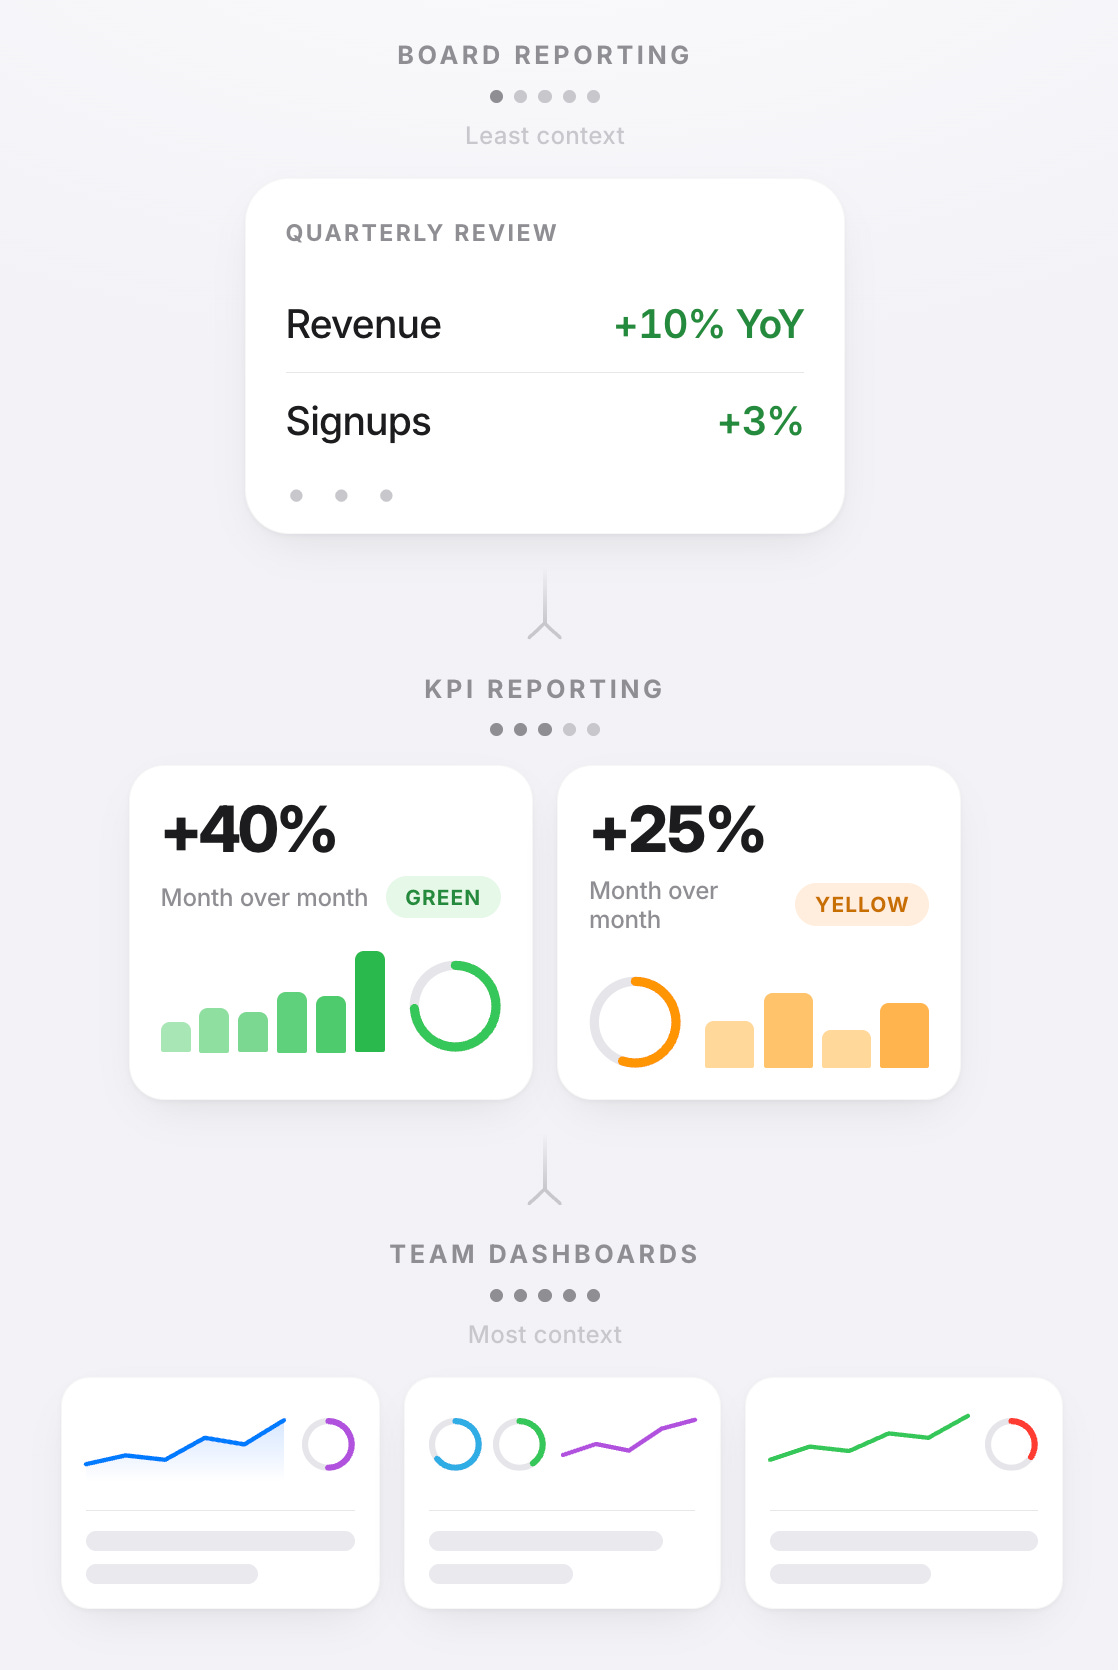
Context is stripped away at each stage as the metrics flow upward. An engineer knows what the metric measures and how the system behaves when it moves. A manager knows it’s trending in the right direction and has a story for why. Leadership knows the number. By the time a metric reaches the top, it’s been separated from the system knowledge that grounds it.
This pipeline of abstraction reflects how organizational systems are designed, and how incentives are structured. The engineer is paid to ship features and keep the pager quiet; drawing a through line from their system to leadership three levels up isn’t in the job. The manager owes leadership a clear story, not an accounting of what the metric might fail to capture. Leadership needs metrics to govern by, and interrogating each one against its underlying mechanisms isn’t scalable at that altitude. P&L owners make headcount and product strategy decisions based on information that has been compressed and separated from its original context. The work of connecting numbers to understanding falls between roles rather than inside any of them.
The result is often an environment where metrics are abundant but understanding is scarce because the connective tissue is absent. Without an understanding of how a business outcome metric relates to the service-level metrics that support it, and to the related raw system signals underneath, companies end up making decisions from numbers they can’t validate.
The gap becomes visible when a top-line metric turns red and someone asks, “Why?” The efficiency that made it easy to communicate product health upward becomes a liability. The director doesn’t have the intermediate metrics on hand, the manager’s story doesn’t reach far enough down, and eventually a tech lead is explaining how the system works to an audience that just needs an answer. No one in that chain has done anything wrong; the chain simply doesn’t convey context in the same way that it carries numbers.
Mapping what drives what
The best way to avoid this common deficit is to capture the causal relationships between metrics up, down, and across the product stack. When a top-line business metric moves, it’s because other metrics beneath it are moving, and usually more than one of them could be behind it. If an organization can’t see those relationships, it can’t explain why the top-line metric is moving, and that’s a problem for the business.
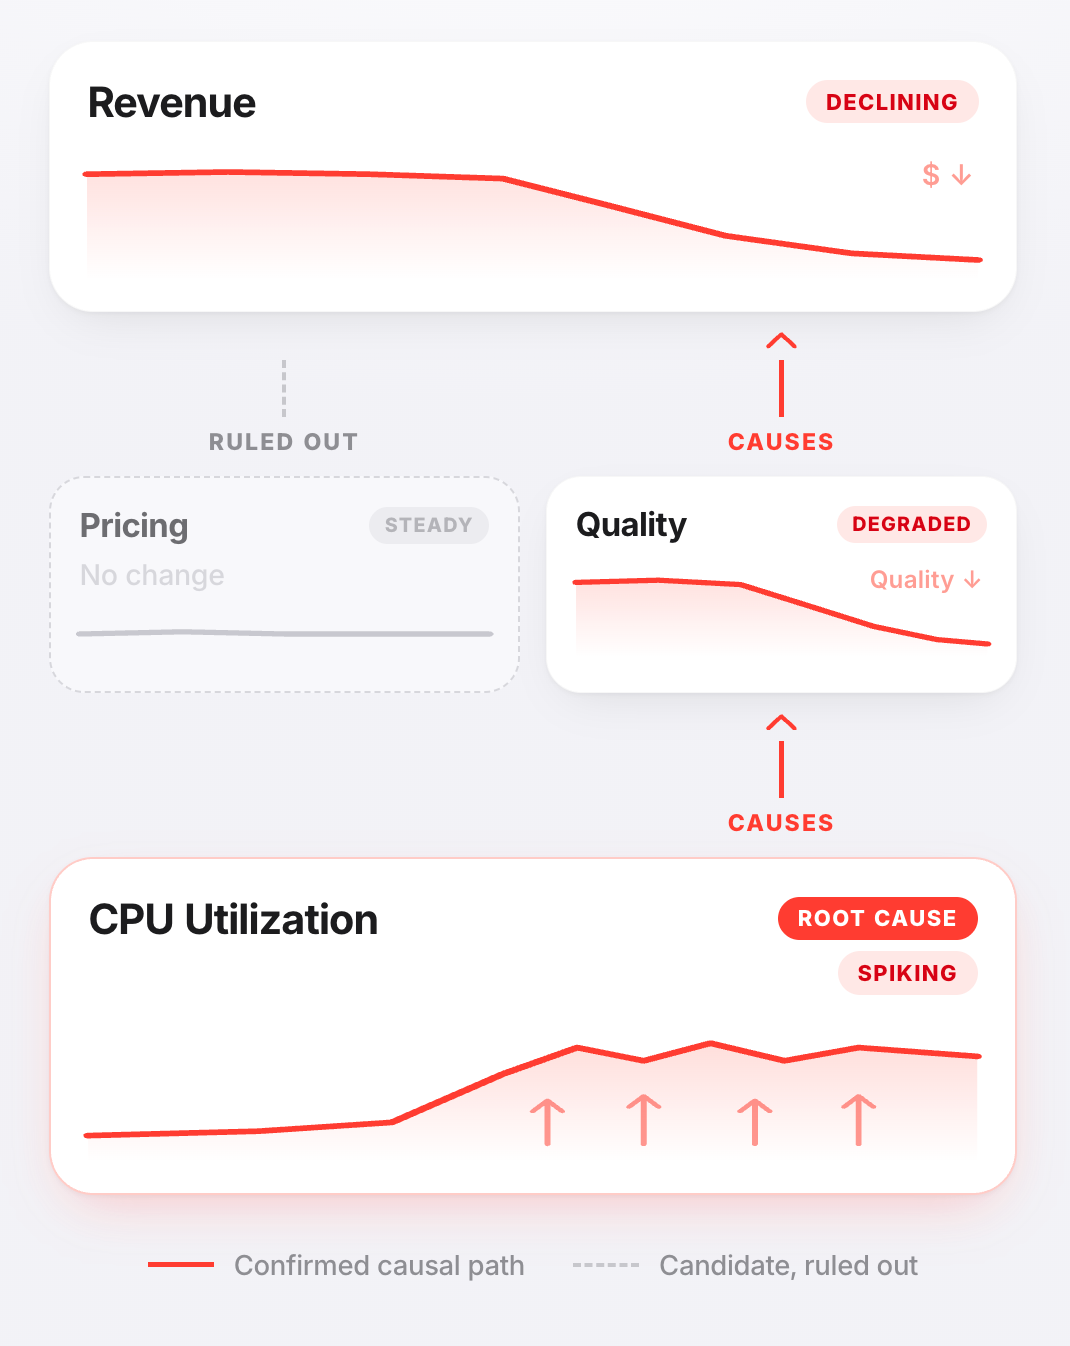
For example, imagine that revenue starts to decline. Often revenue drops because quality degraded, and quality degraded because of an underlying systems issue like CPU utilization spiking (see Figure 2). If leadership only sees the revenue decline and assumes it’s a pricing issue, the organization risks spending time solving for the wrong problem. Engineering cycles get burned, the metric stays red, leadership loses confidence, and the actual root cause continues to compound underneath.
Two tests for every metric
The work starts with cutting, not adding. Most product and engineering teams approach metrics as an additive exercise:
What else should we measure?
What dashboard should we build?
What new instrumentation should we add?
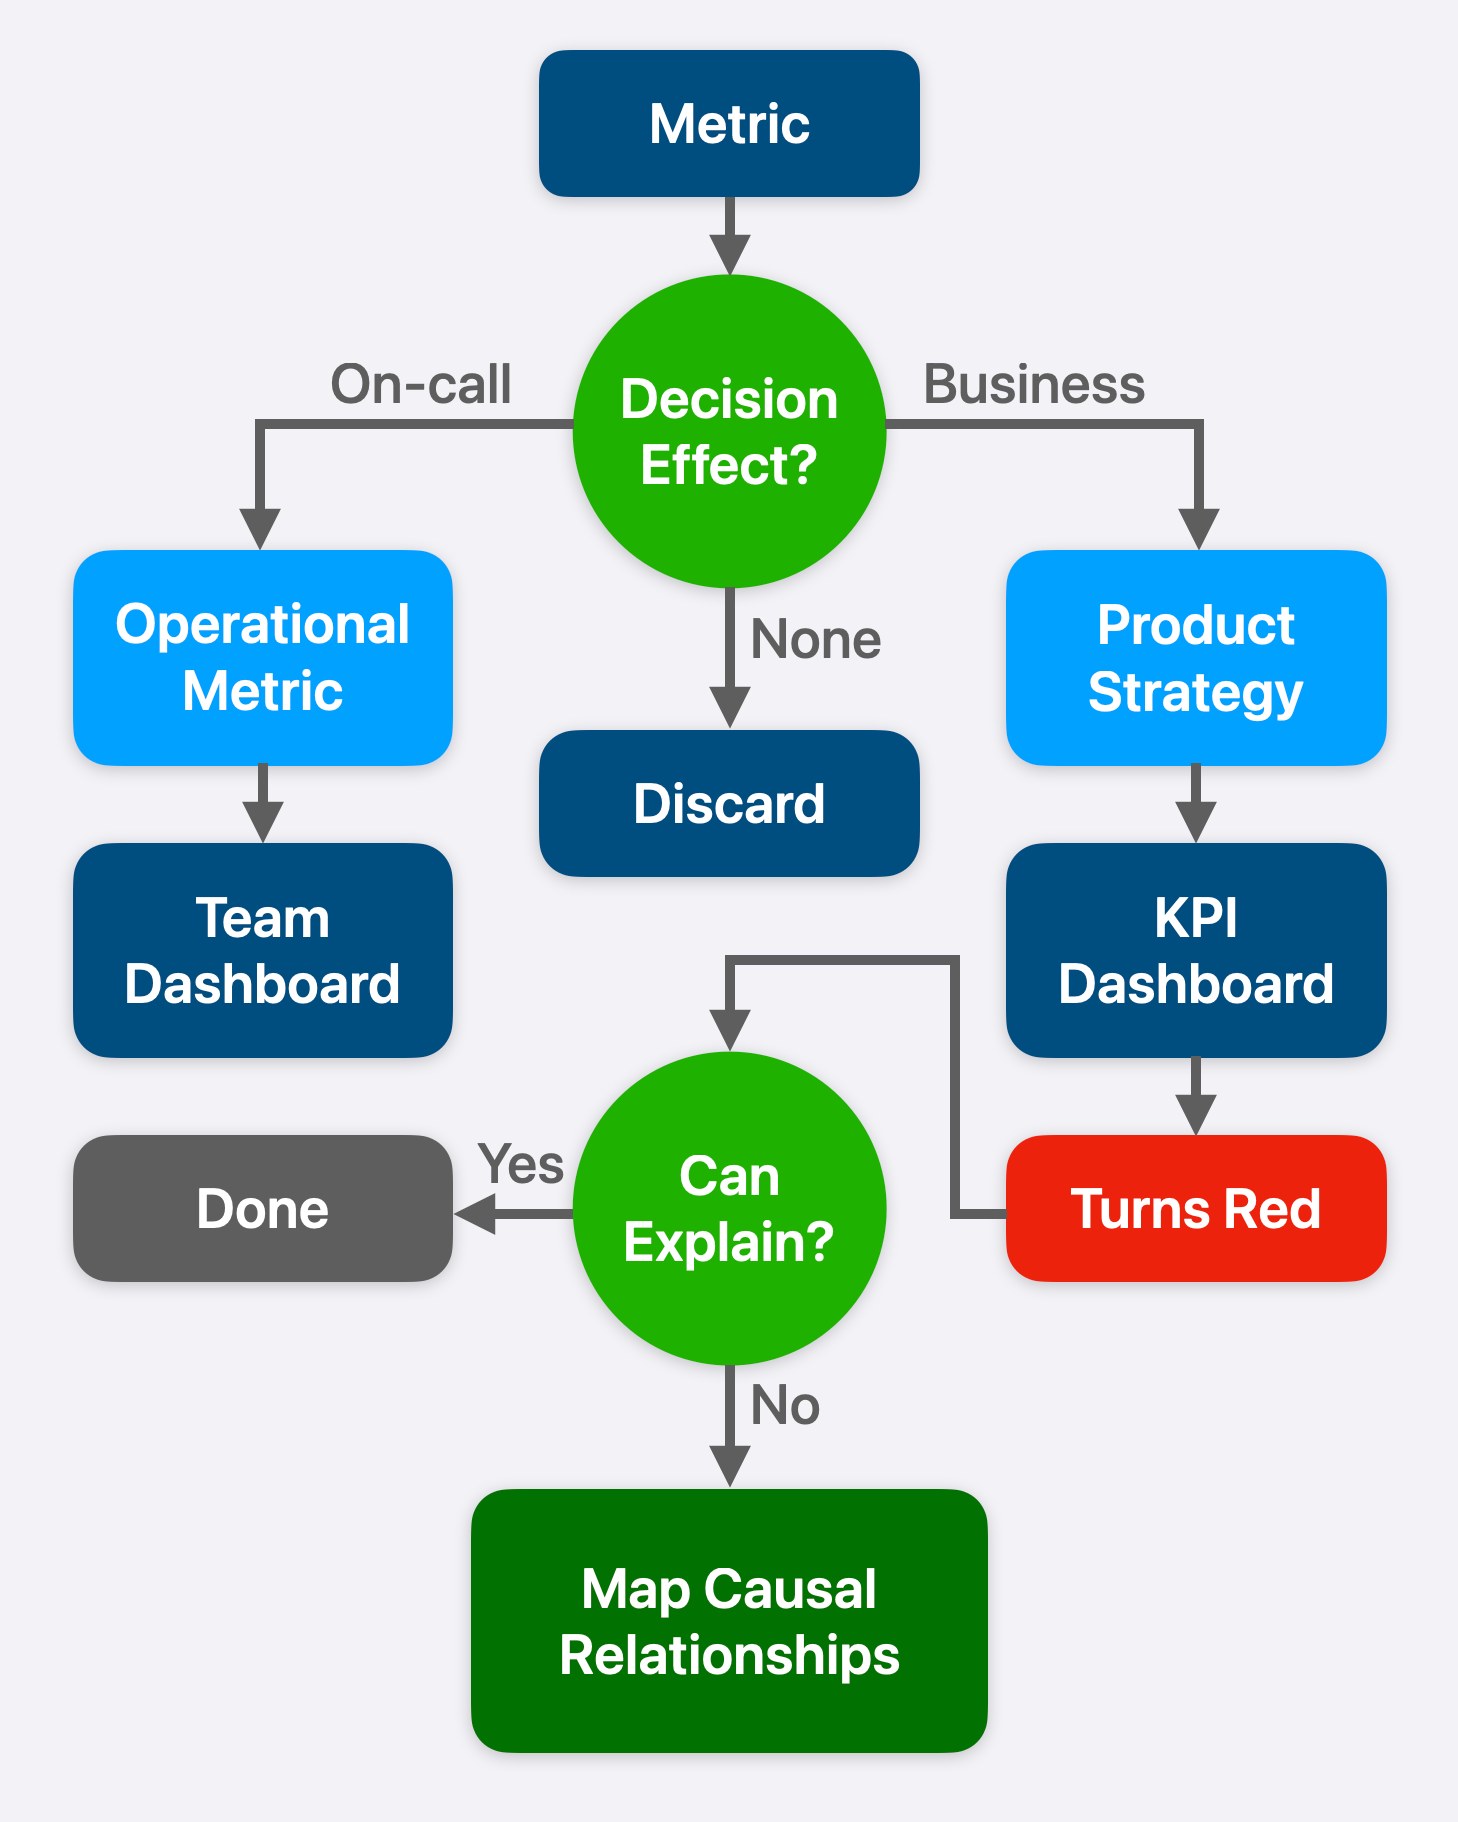
New initiatives bring new metrics, and old ones rarely get retired, resulting in accumulation. Product and engineering leadership should review the metrics they currently track together and eliminate everything that doesn’t pass the two tests (see Figure 3):
What decision could this metric change, and for whom?
If it turns red, can the team explain why?
When in doubt, discard the metric. If you’re not adding some back in later, you didn’t cut enough in the first place.
This is a joint exercise. An engineering manager runs the tests against the metrics their team tracks. If a metric helps the engineer on-call debug an incident, it’s an operational metric: keep it on the team dashboard. If it tells the C-Suite how much revenue the product is generating, it’s a business metric: present it to leadership. If nobody can answer the question, throw it away! P&L owners should be running the same test from the other direction: For every metric I’m being shown, what decision am I supposed to make with it? If the answer isn’t clear, push back.
For each metric that survives, someone needs to own the question: If it turns red tomorrow, can the team explain why? Not speculate, or bring in a tech lead to do an architecture deep dive, but actually explain what moved and the cause? If the answer is no, then causal relationships haven’t been established. Product and engineering leadership must assign this work as part of how the team ships, with dedicated resources and accountability for finishing it.
What this costs leadership, and who can fix it
When the effort of understanding metrics is positioned as a separate initiative, it is often starved. Feature work is tied to revenue and will always win the resource fight, and it should. The way to fund an effective metrics effort is not to give it its own line item, but to build it into how teams ship, so that it draws from the same budget and the same engineering cycles.
P&L owners should look for excellence in metrics embedded in their teams’ shipping process, not sitting on a separate roadmap competing for resources it will never win. If the metrics reaching the quarterly review can’t be traced back to the system behavior that drives them, then the organization hasn’t done the work yet, and the P&L owner is the person with the authority and the budget to make it happen.
What world class organizations do
In order to know what’s actually driving the business, product and engineering should map the relationships between metrics top to bottom as part of planning and shipping. Product defines which outcomes matter, and engineering maps how the system metrics drive those outcomes.
Together the product team, and the engineering organization supporting it, must be able to trace the metric’s movement. If it turns red, can a manager point to the intermediate metrics that explain why, and follow the breadcrumbs from business outcome, through service behavior, to root cause? If not, as soon as the top-line business metric moves out of range, it’s time for a code red.
If this feels familiar, know that it’s nearly universal. The work ahead is figuring out which metrics should stay or go, and developing the capability to understand the ones you keep. Pick a place to start, keep it simple, and focus on an area where you’re most likely to earn early wins: for example, the service your team knows best, or the one you most recently had to do a deep dive on due to an incident. In practice this means running those two tests for each metric you are examining. The goal is to understand what the metric tells you, and whether it matters.
Working from the metrics that have passed the tests, narrow the scope to what the organization is actually trying to answer. Don’t attempt to map causal relationships across the entire product ecosystem. Focus on the three to five services that matter most to the business. If it’s not obvious which ones those are, then product and engineering leadership must ask together: Which services have triggered a code red in the past, which ones directly generate revenue, and which ones would have leadership asking questions within an hour of going down? Once there’s a short list, you can bring it to the P&L owner for alignment.
Mechanics for engineering teams
The following practices have proven valuable to engineering teams. P&L owners may find it useful to understand what they’re funding, but the suggestions here are for the people doing the work.
What are some good mechanics to use for embarking on this process? It depends on where your engineering team is at, in terms of maturity.
If the engineering team doesn’t have production on-call handoffs, now is a great time to set them up:
Schedule a weekly team sync where the outgoing engineer hands off context about what happened in production to the incoming engineer.
Use this forum to identify and discuss emerging trends and, importantly, make decisions about what to do and who will do it. For example, what do you do with an inactionable alert?
Discuss, investigate, and assign an owner to address issues before fatigue sets in and people on rotation start ignoring signals (like ignoring alerts in the example above).
If the engineering team is already doing handoffs:
Establish a cadence of internal metrics reviews.
Devote the first 10 minutes of the handoff meeting to reviewing the metrics that the team currently tracks: Are they behaving as expected, are any missing, and does each one still belong in the review?
Once you’ve got a good internal metrics review cadence going, start a forum with peer teams where each one presents the metrics they track for their services and how they interpret them. This is where you pressure test whether what you’re projecting outside the team holds up, practice explaining your metrics to people who don’t share your context, and discover causal relationships that cross team boundaries.
These practices will surface gaps, and that’s what makes them so valuable. Metrics that can’t be explained, alerts that aren’t actionable, and causal relationships that haven’t been mapped, are all important information. Often the gaps accumulate into an operational backlog which sits alongside the feature roadmap, and in most organizations the feature roadmap draws the resources first. The way forward is to treat the gaps as part of the feature work itself. If a feature moves a metric, explaining why is part of shipping that feature, not a separate item for a separate backlog.
A final word
Developing metrics as an effective tool for decision making is a process that begins with collecting the right data, and grows in importance and impact as that data reaches more people. It’s important that this develops alongside a capacity to reason about what the numbers really mean. An organization where understanding flows upward alongside the numbers will always be in a stronger position to make strong, data-driven decisions.